Introduction

For this project, I decided to analyse Pokémon from Generation 1. I chose this dataset because Pokémon is something most people know about and the data is easy to sort into groups. Every Pokémon has at least one type like Water, Fire, Grass or Electric. Some Pokémon also have a second type. This made the dataset good for comparing how common different types are.
The aim of this project was to see if Pokémon types in Generation 1 were balanced or if some types appeared much more than others. I wanted to find out which types were the most common and rarest and how often types appeared as primary or secondary types. This project also helped me practise using Python, HTML and CSS.
Dataset Used

The dataset I used contained information about Generation 1 Pokémon. The main data included the Pokémon number, name, main type, second type, height, weight and battle stats. For my project, I mainly focused on the Type1 and Type2 columns. Type1 shows the Pokémon’s main type and Type2 shows if the Pokémon has a second type.
I decided to focus on typing because it is one of the most important parts of Pokémon. Types are used to group Pokémon and compare them with each other. By looking at the type data, I was able to create graphs that showed patterns in the original 151 Pokémon
Questions I Investigated

- Which Pokémon types appear most often in Generation 1?
- Which Pokémon types are the least common?
- How do primary types compare with secondary types?
- Are Pokémon types evenly distributed?
- Which dual-type combinations appear most often?
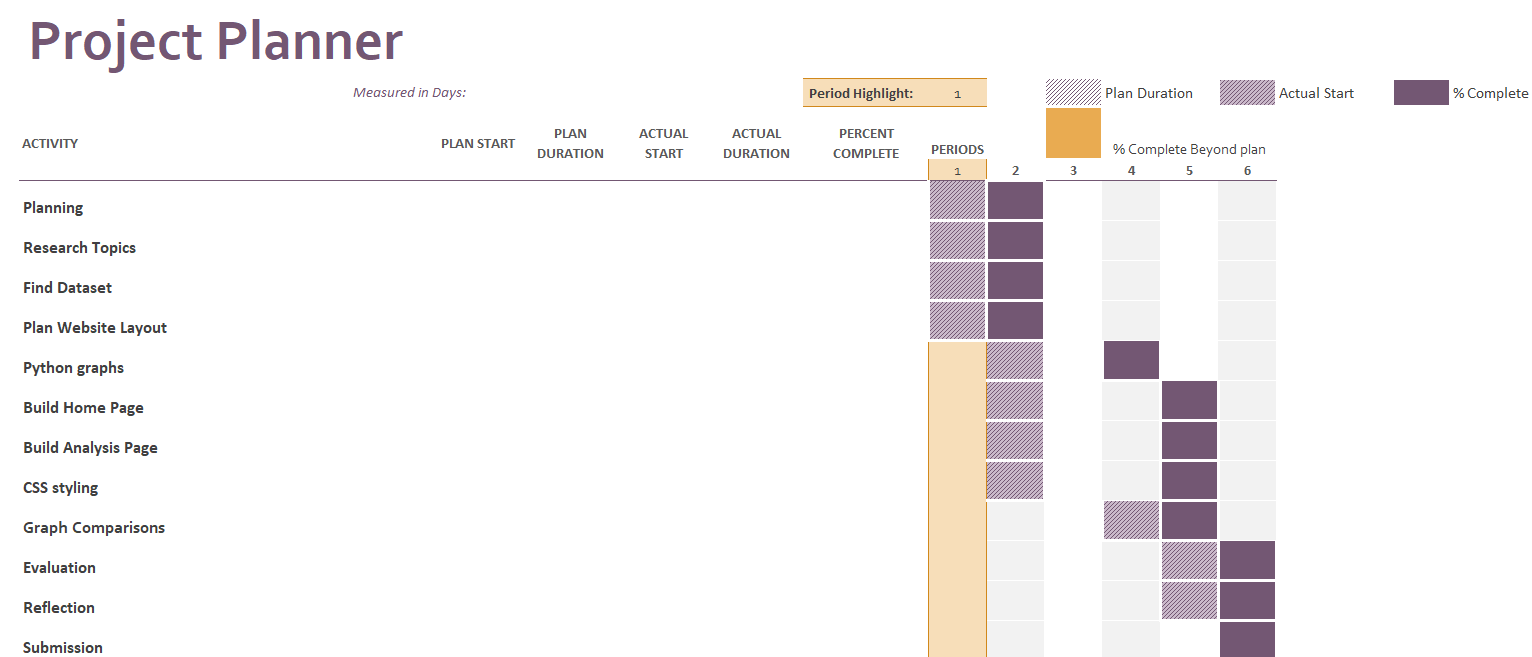
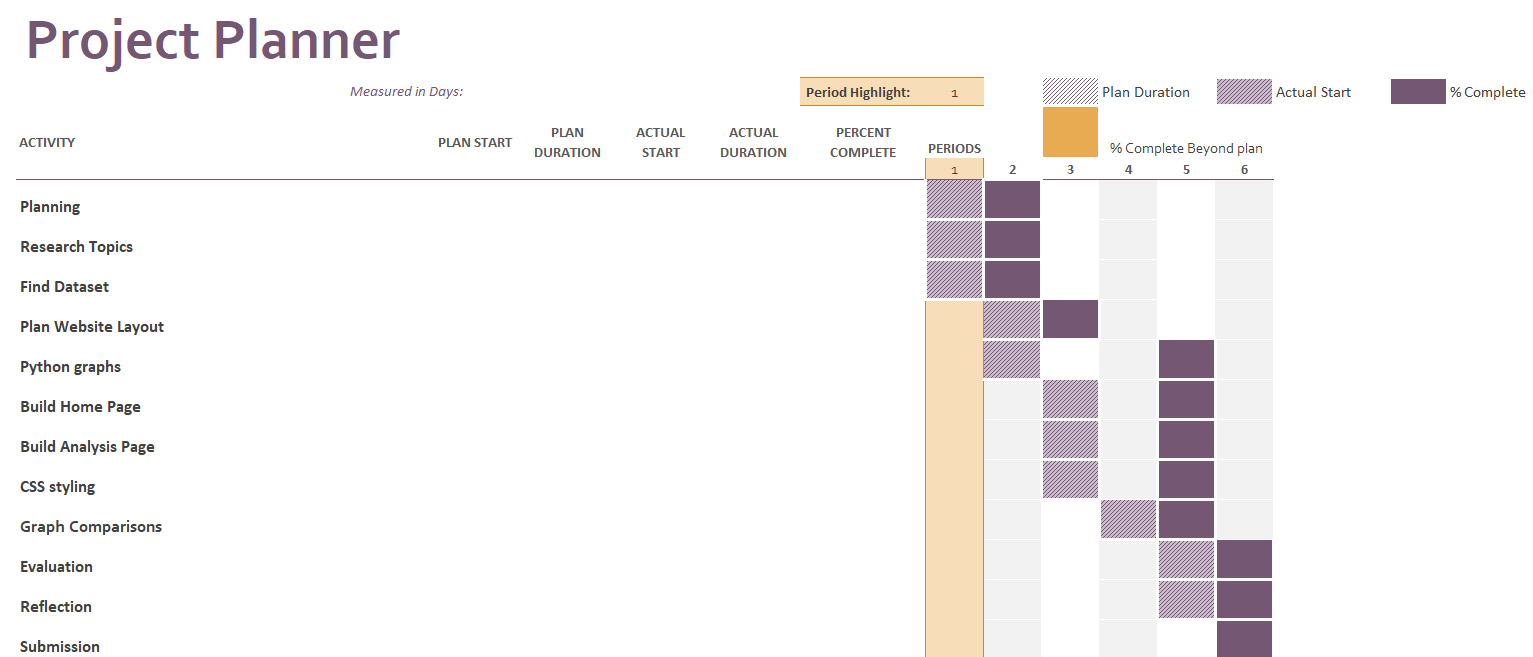
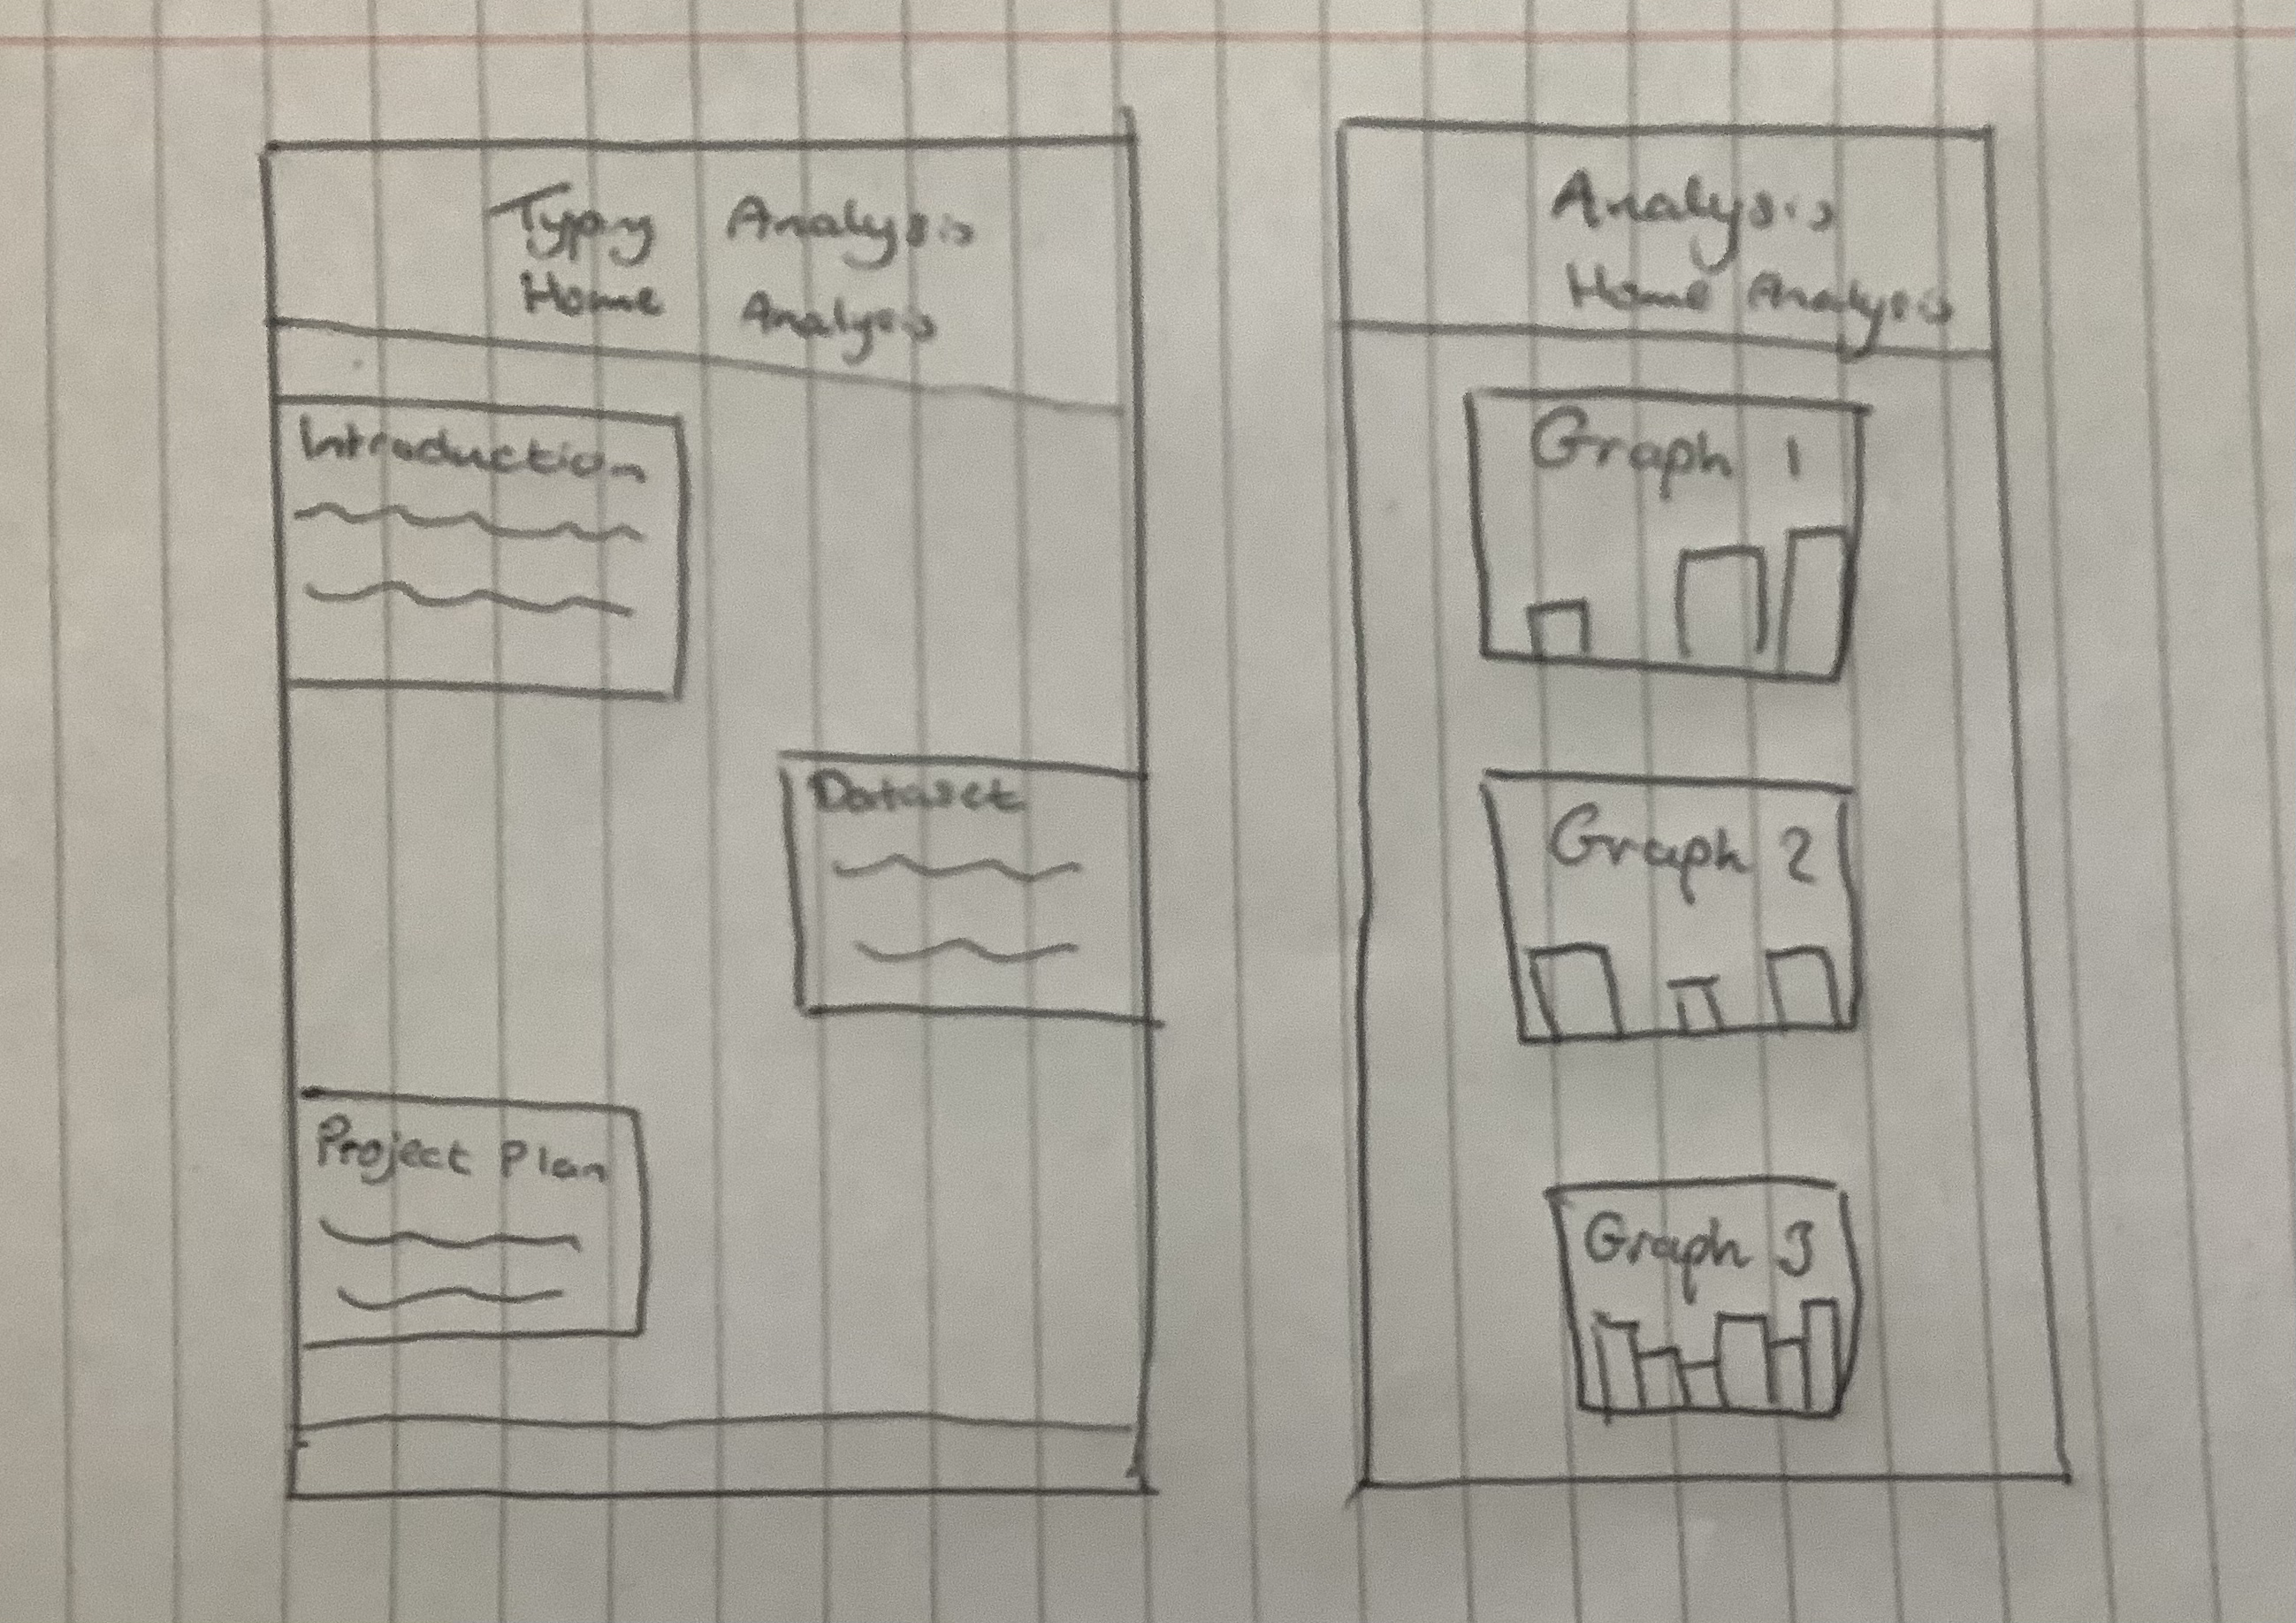
Project Planning

Before making the final website, I planned the project by choosing a dataset, deciding what questions I wanted to answer and designing a simple layout for the website. I then used Python to analyse the data and make graphs. After that, I created the HTML pages and used CSS to style the website. I also added explanations beside each graph so the results would be easier to understand.
The main stages of the project were choosing the dataset, cleaning the data, creating graphs, saving the graph images, building the website, writing the analysis, adding CSS styling and checking that everything worked properly.