Graph 1: Type Distribution

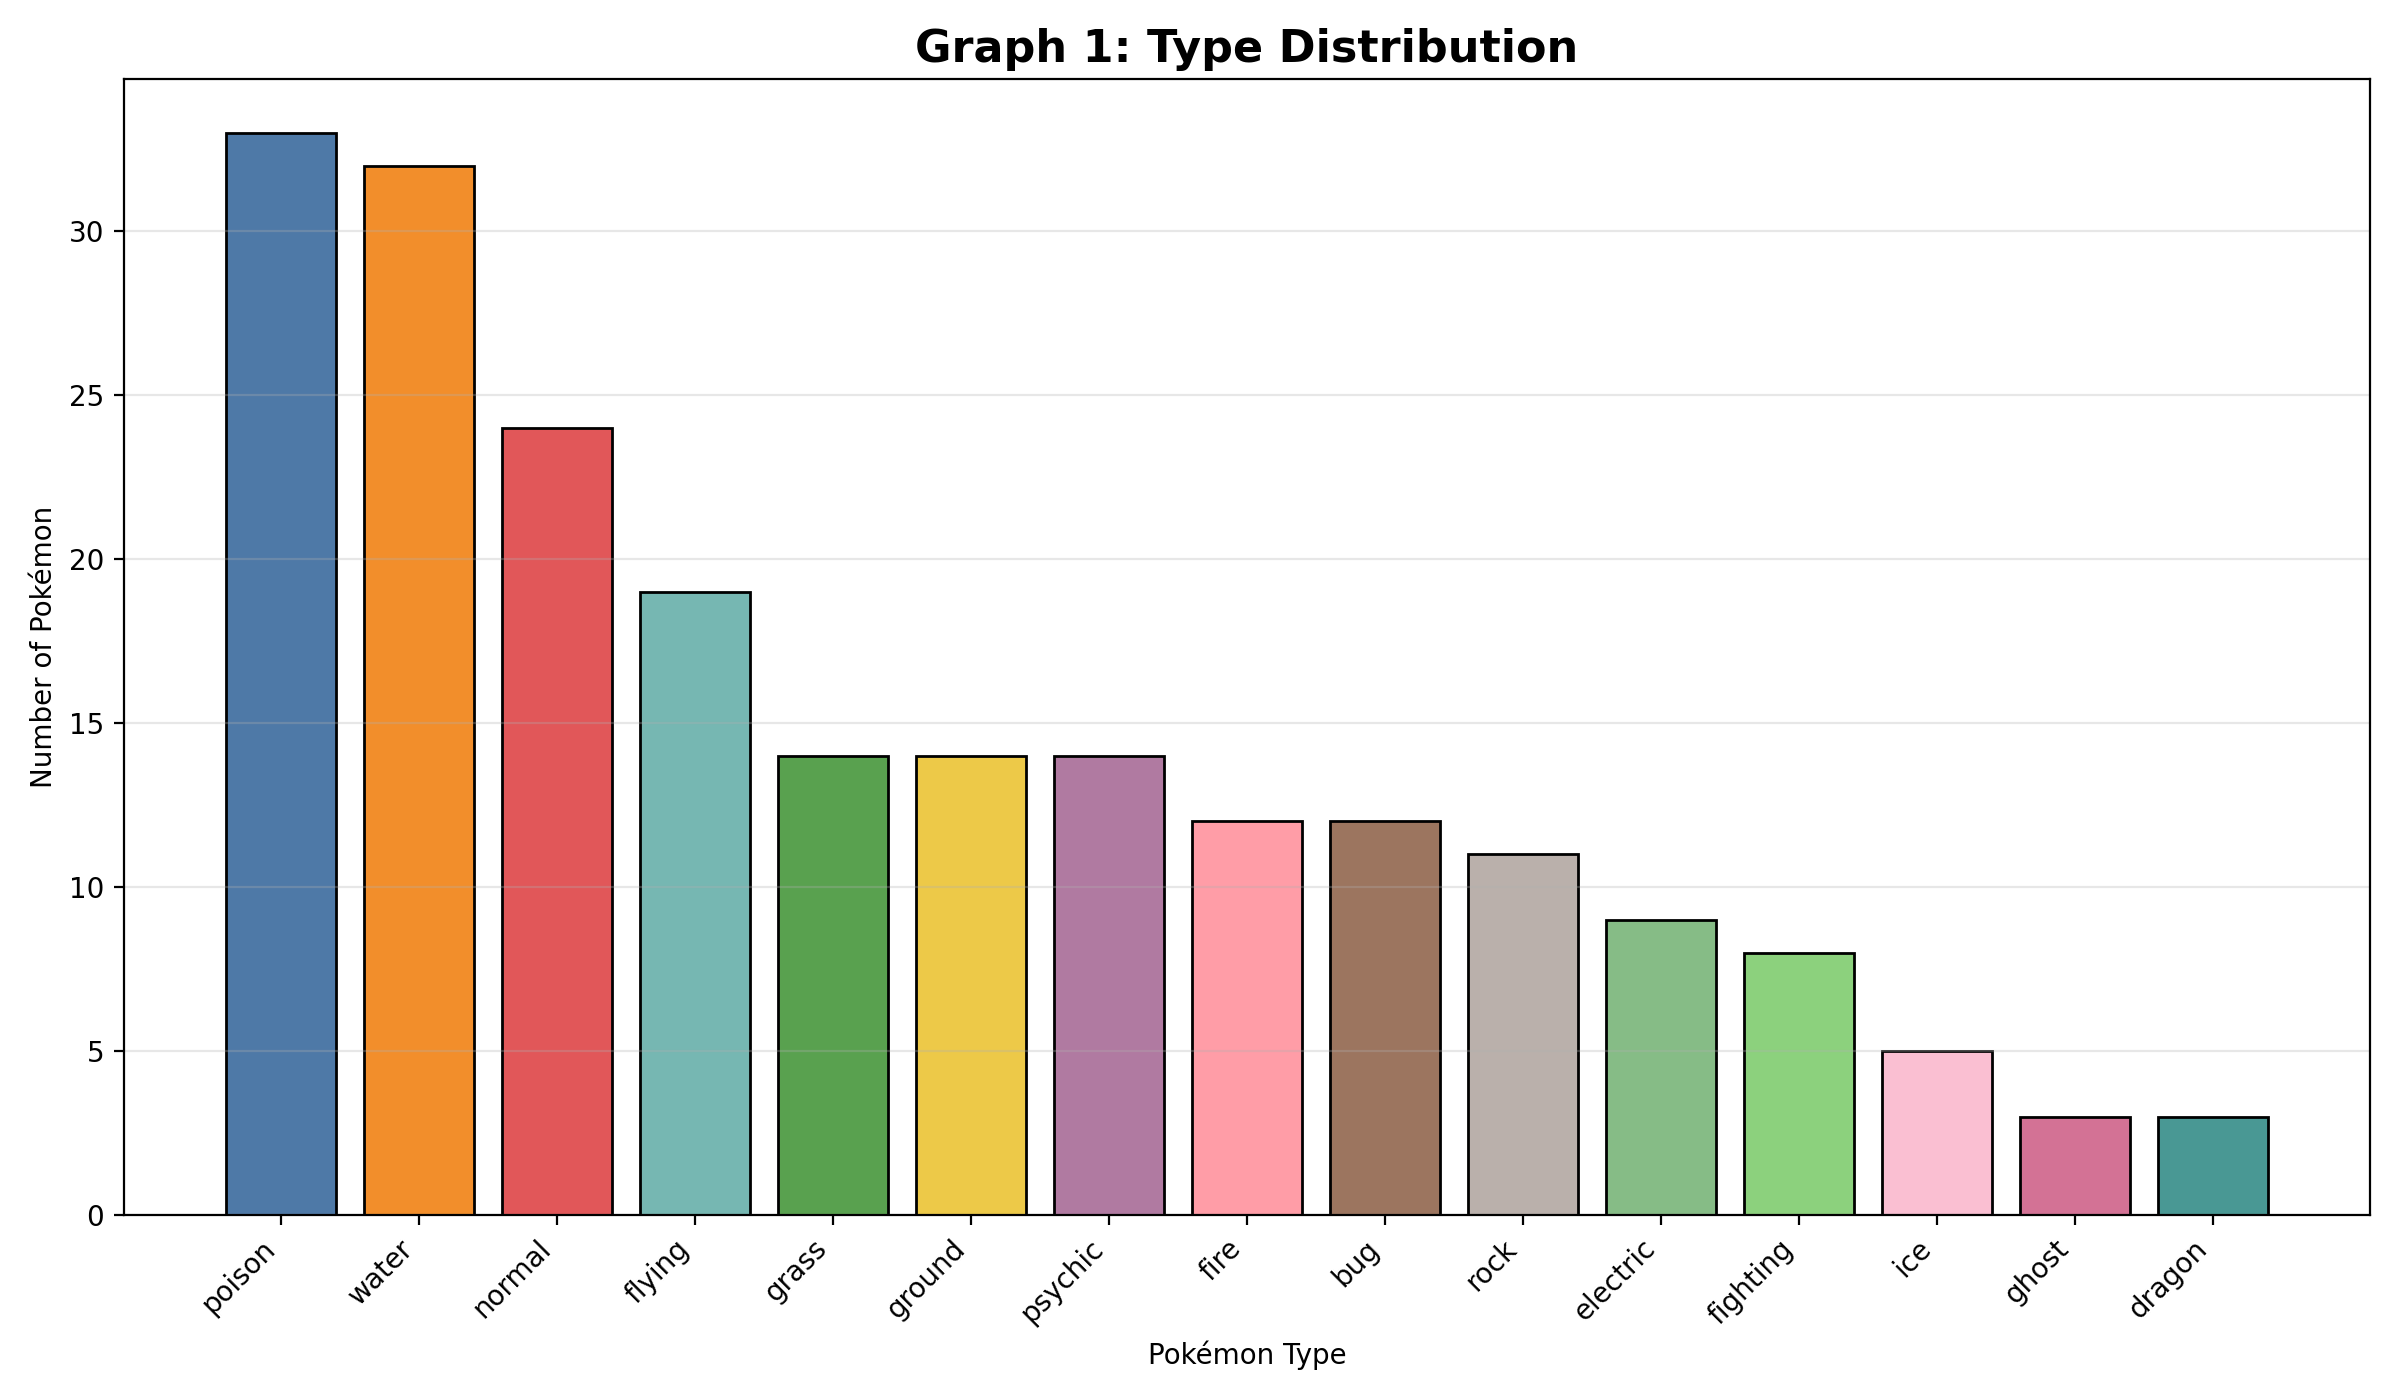
This graph shows the overall type distribution of Generation 1 Pokémon. It counts every type when it appears as either a main type or a secondary type. The graph gives a good overview of which types are most common in the dataset. From the results, it is clear that some types appear much more often than others.
Graph 2: Primary vs Secondary Types

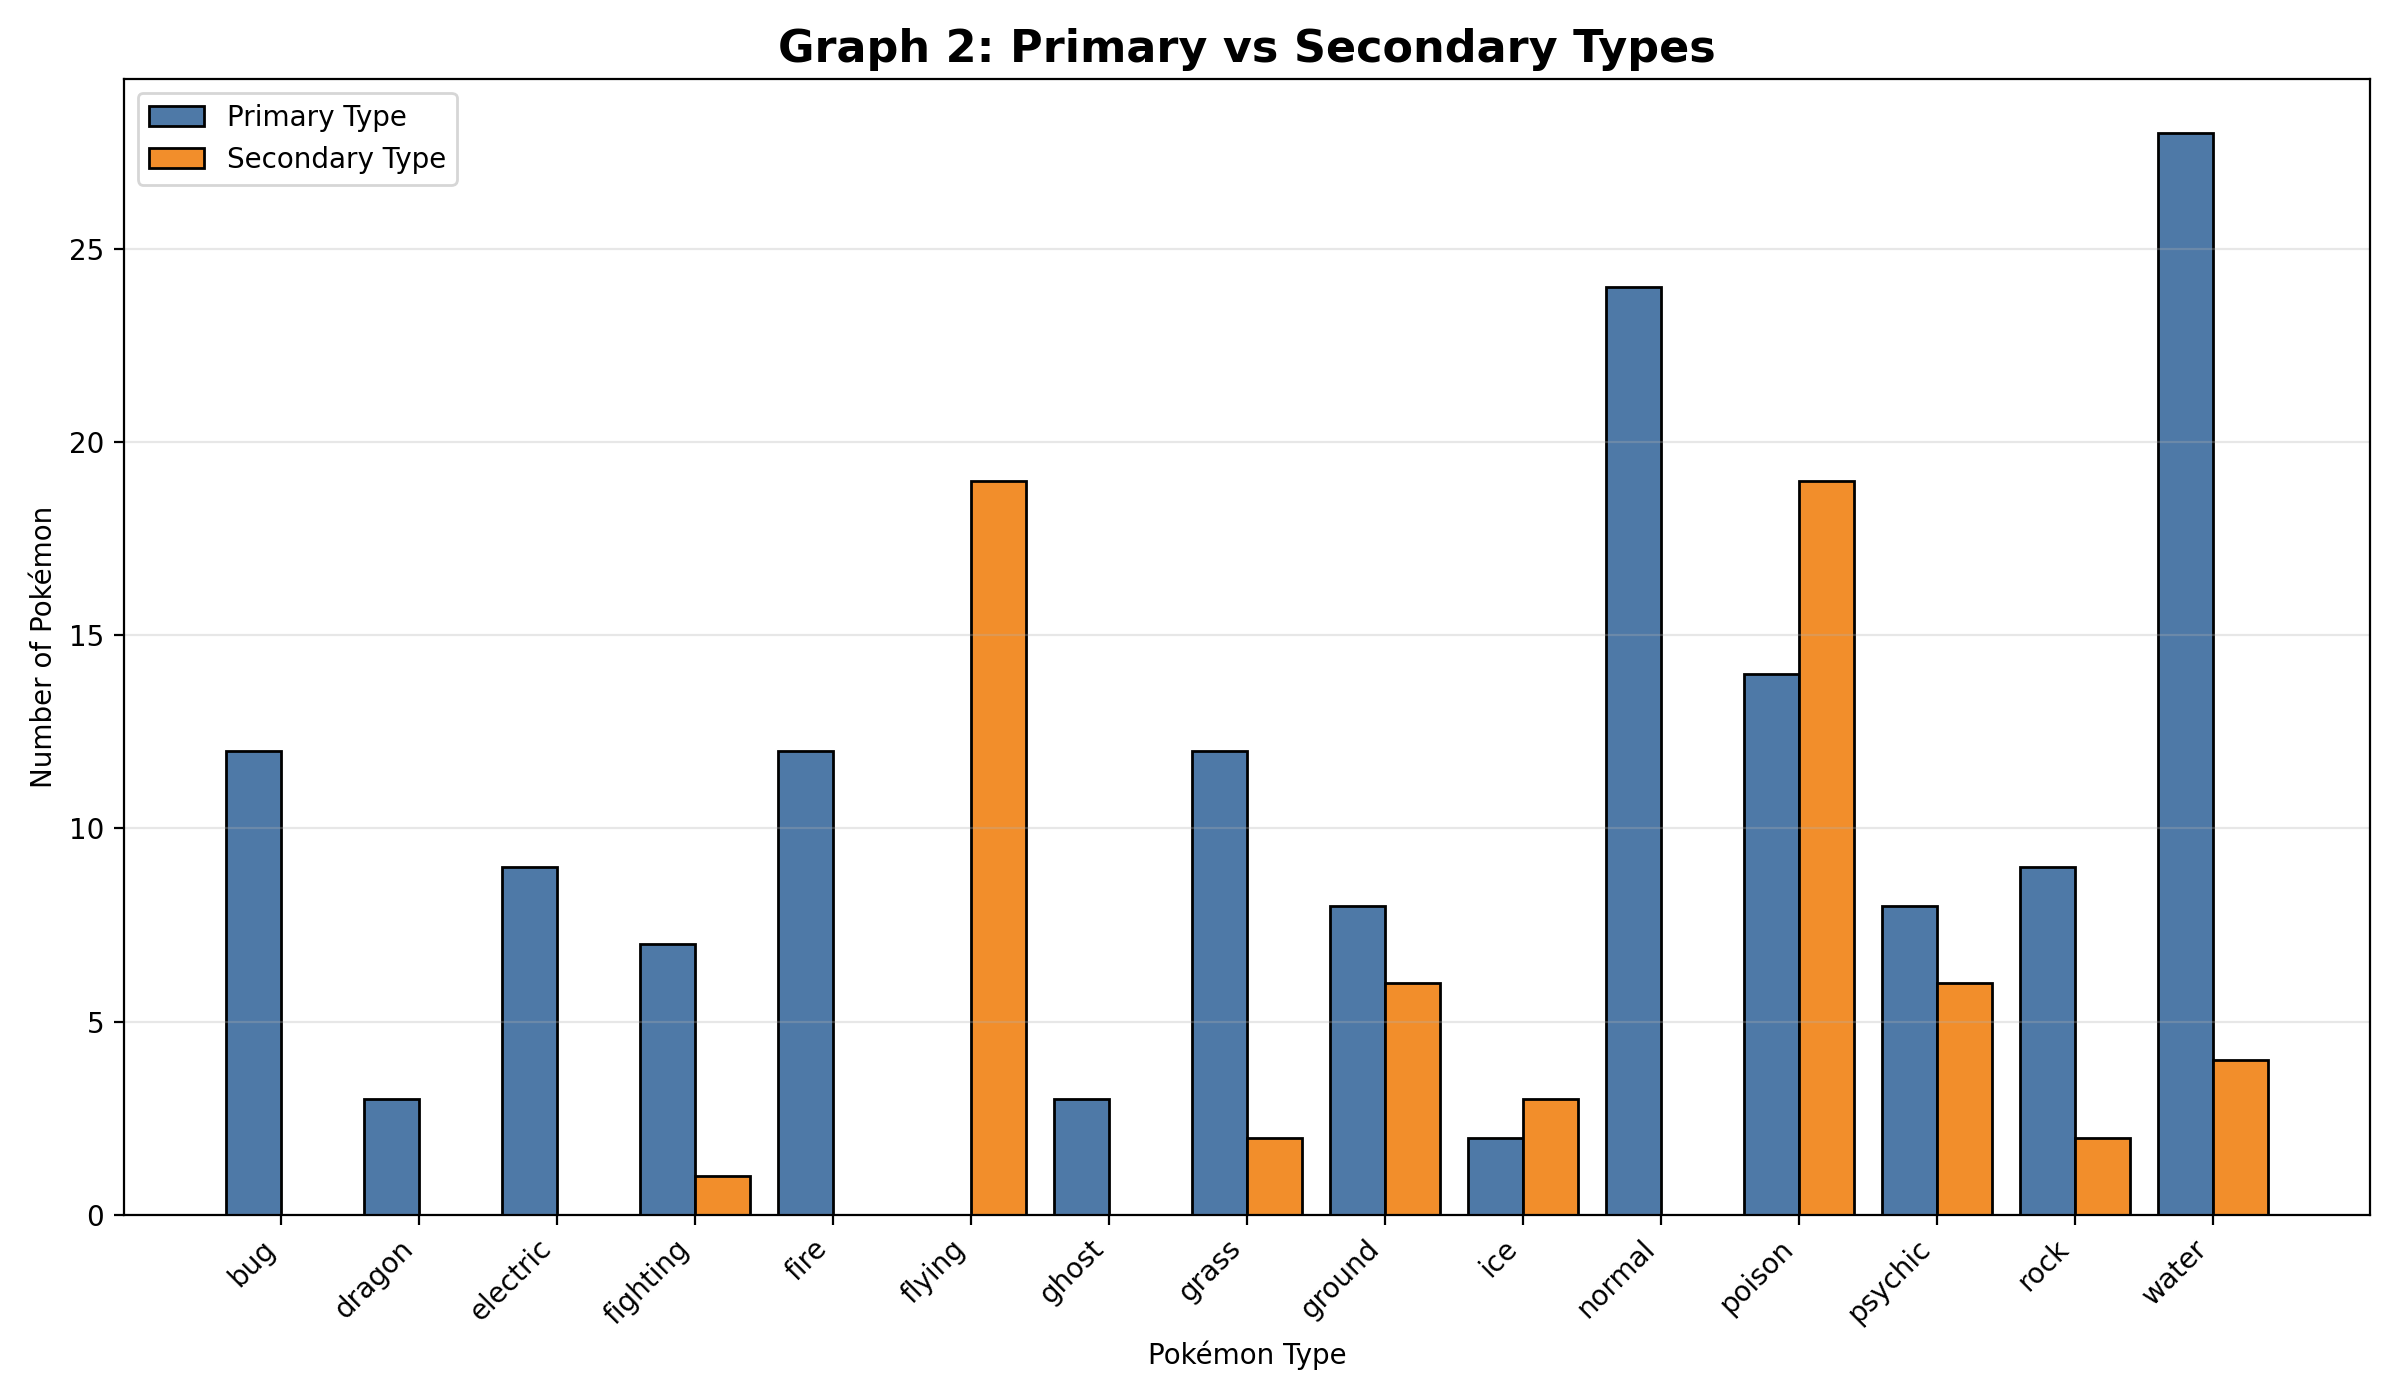
This graph compares how often each type appears as a primary type and as a secondary type. This is useful because some types are common as main types but not as second types. The graph helps show how different types were used in Generation 1 Pokémon.
Graph 3: Type Disparity

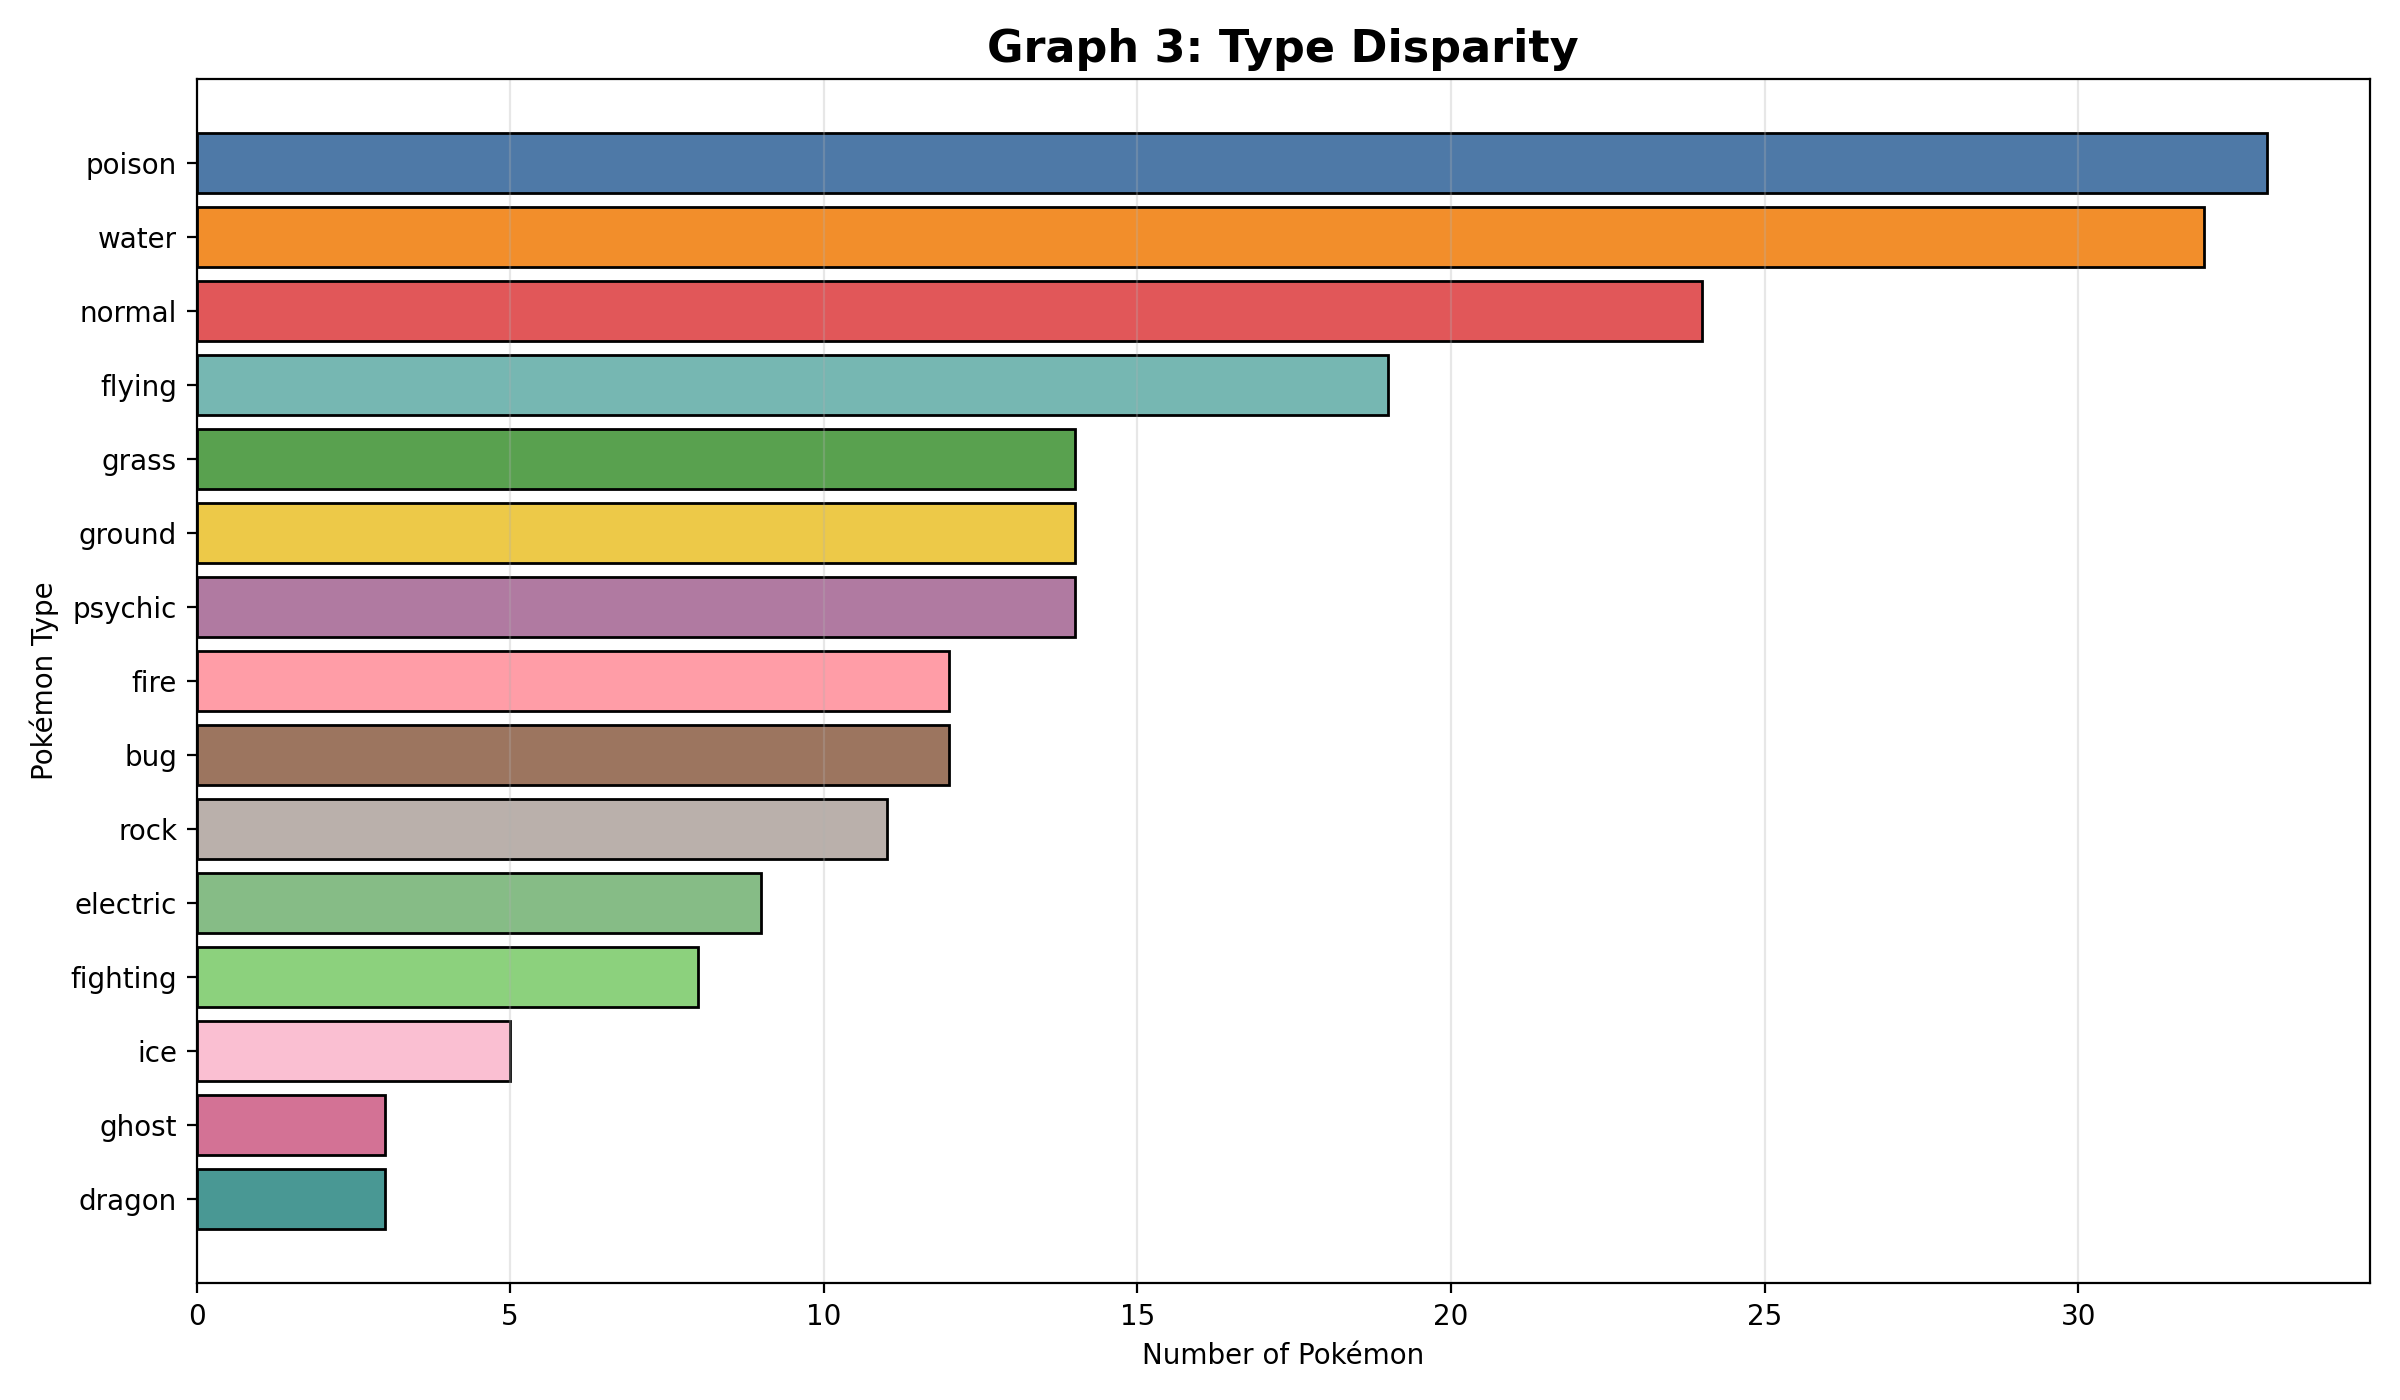
This graph looks at the difference between the most common and least common Pokémon types. It helps show if the type distribution is balanced or uneven. A big difference between the highest and lowest values shows that some types were used much more than others.
Graph 4: Most Common Types

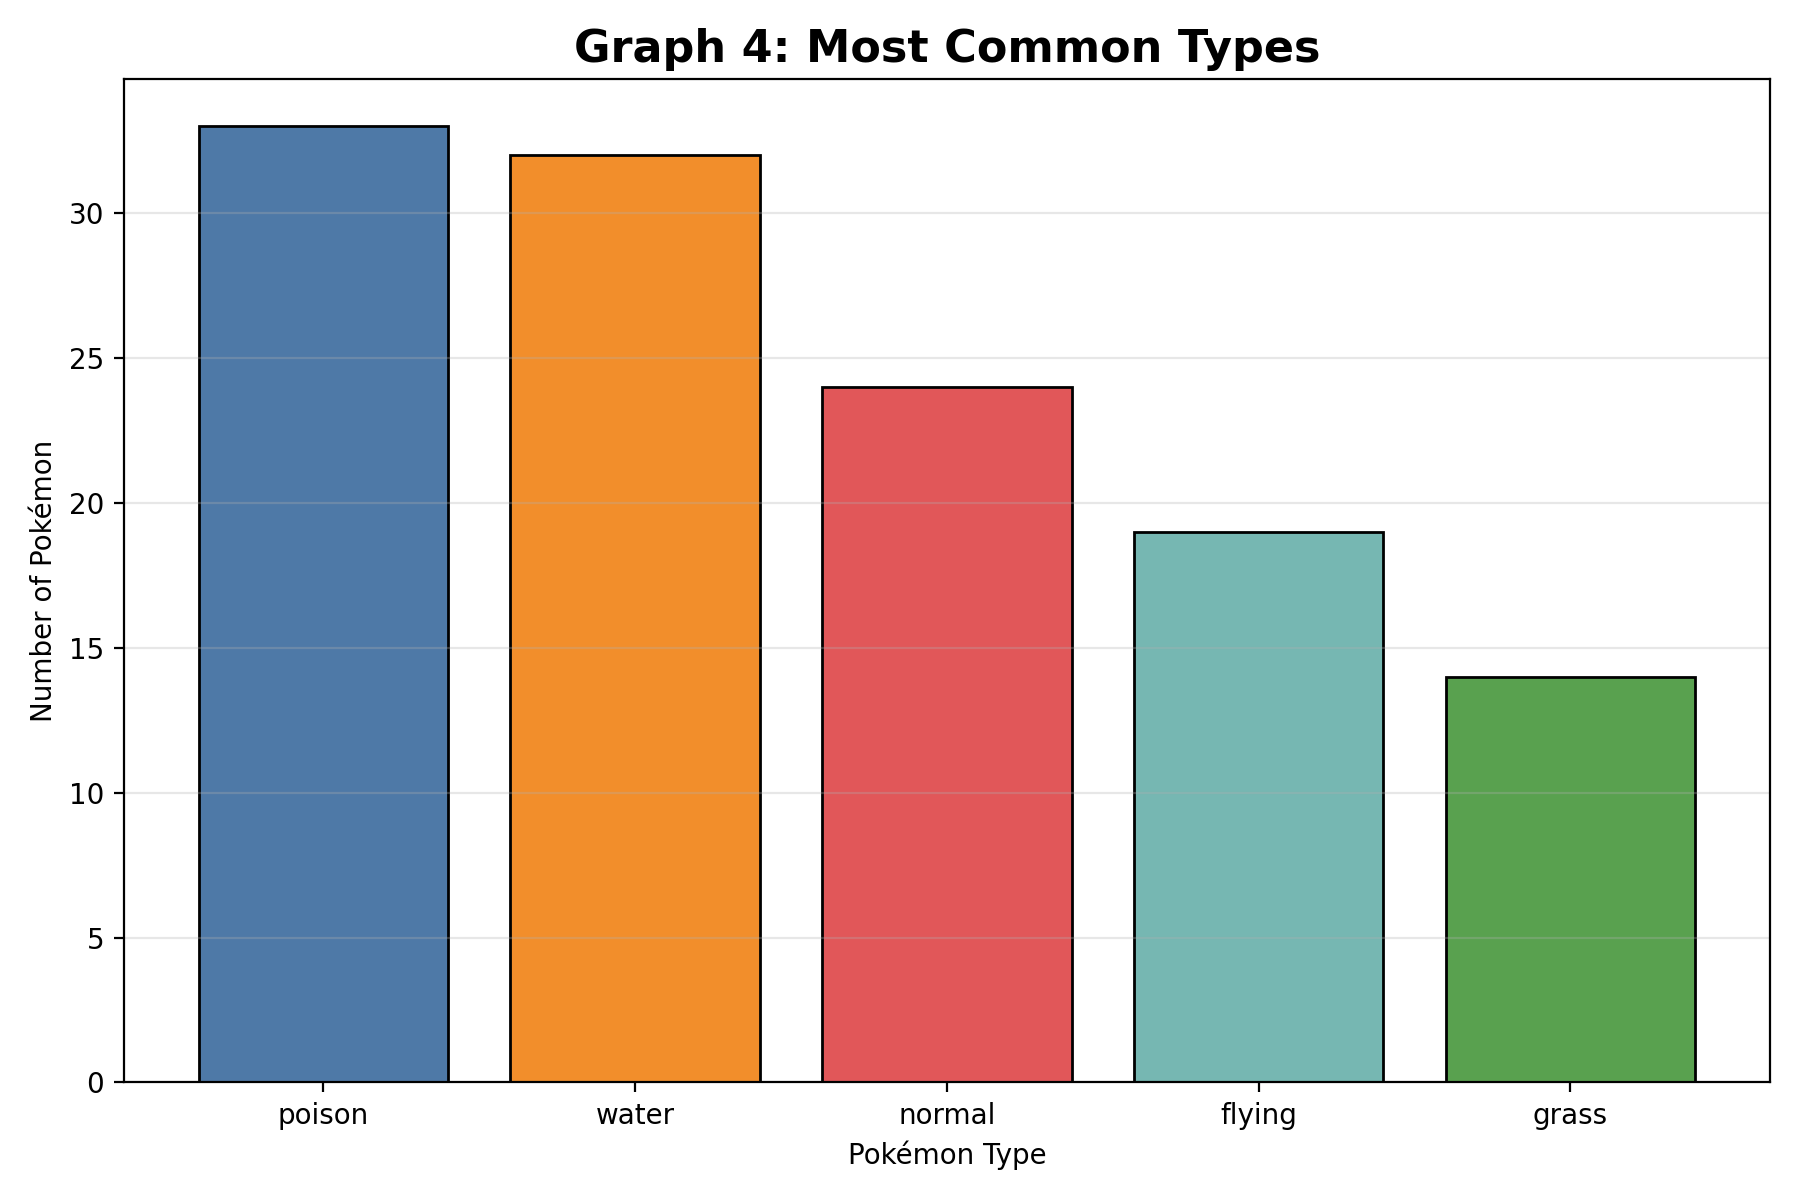
This graph focuses on the Pokémon types that appear the most in Generation 1. It makes it easier to see which types are the most popular without showing all the less common ones. The graph shows that a small number of types make up a large part of the dataset.
Graph 5: Least Common Types

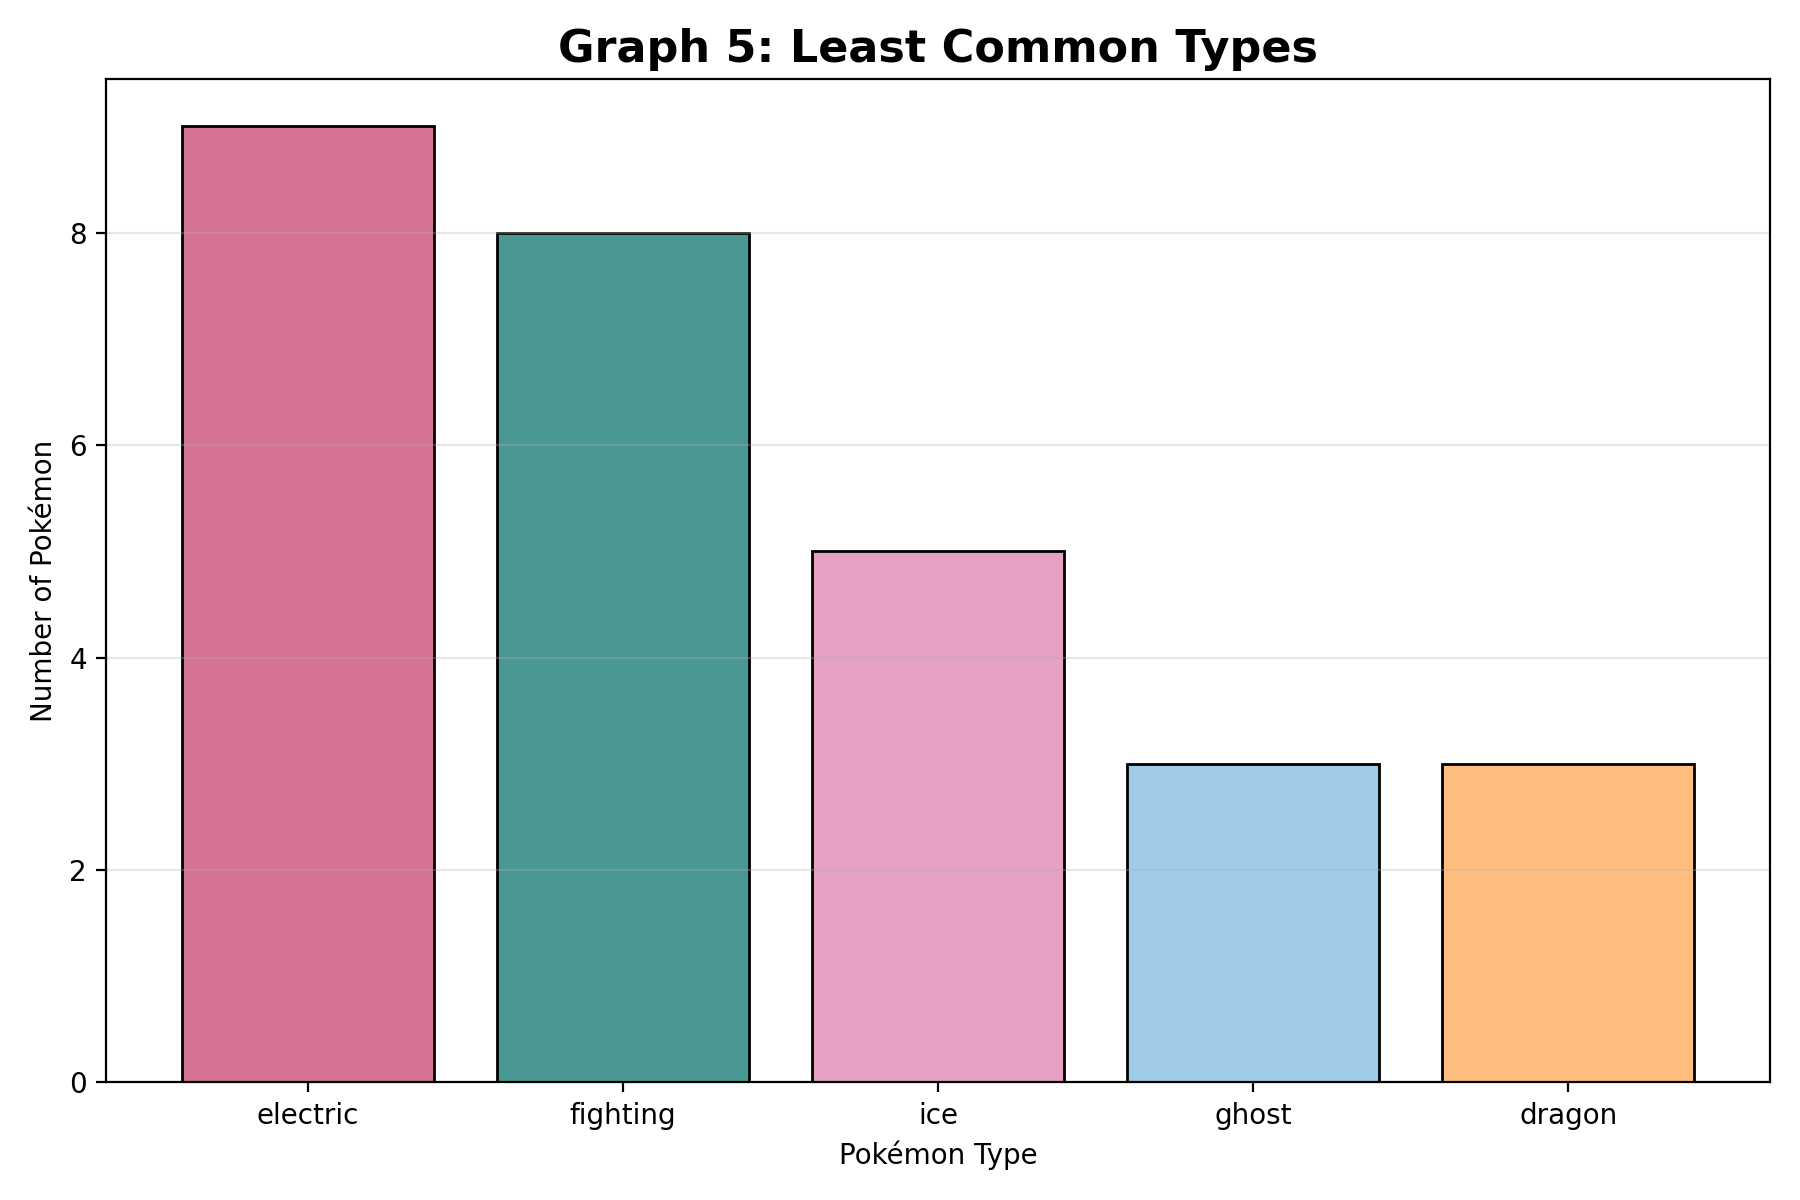
This graph focuses on the rarest Pokémon types in Generation 1. It shows the types that appear the least in the dataset. This is important because it shows which types were not used very often by the game designers.
Graph 6: Dual-Type Combinations
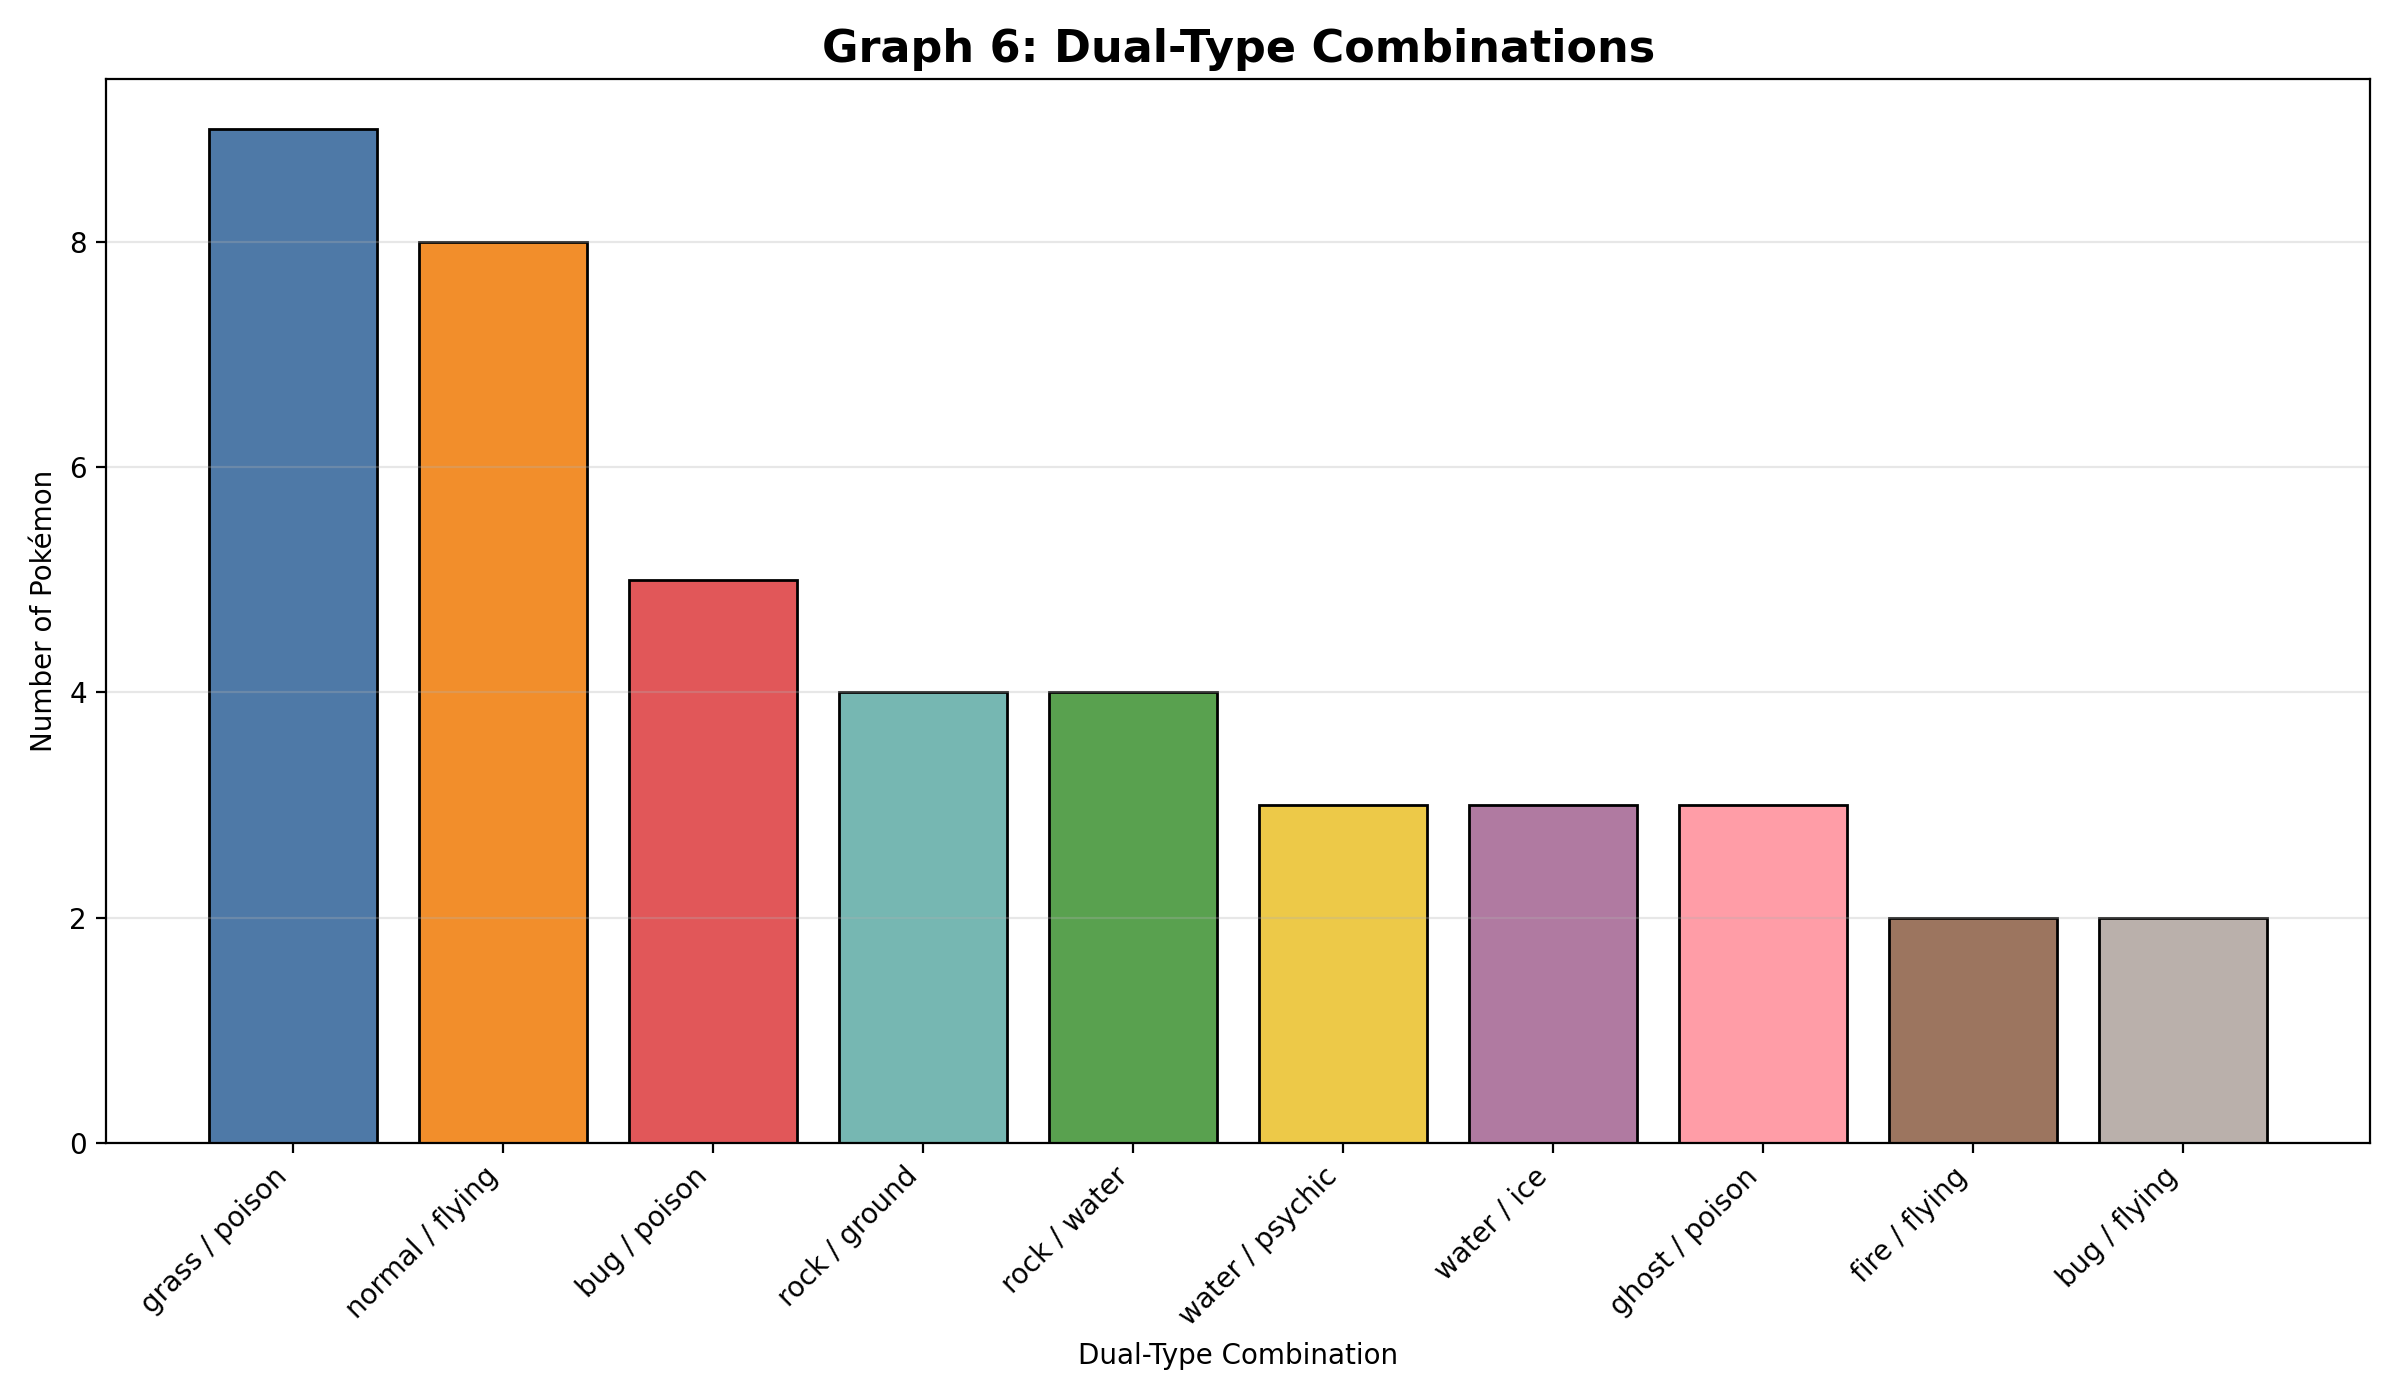
This graph shows the most common dual-type combinations in Generation 1. It only includes Pokémon that have both a main type and a second type. The graph shows patterns in how different types were paired together. Some combinations appeared many times, while others did not appear at all.
Graph Comparison
When comparing the graphs, it is clear that Pokémon types in Generation 1 were not evenly balanced. The type distribution graph and the type disparity graph both show that some types appear much more than others. The most common types graph supports this, while the least common types graph shows that some types were very rare.
The primary versus secondary types graph gives another way of looking at the data because it separates main types from secondary types. This can also be compared with the dual-type combinations graph, which gives more detail about Pokémon with two types. Overall, the graphs show clear patterns in Generation 1 Pokémon typing.
Evaluation
Overall, I think this project was successful because I was able to analyse Generation 1 Pokémon typing data and create graphs that showed clear patterns. The graphs helped make the data easier to understand and helped explain the results clearly on the website.
One thing that could be improved is the size of the project. I only looked at Generation 1 Pokémon, so the results do not show every Pokémon generation. If I improved the project in the future, I could compare different generations to see if Pokémon typing became more balanced over time.
Reflection
During this project, I improved my skills in Python, HTML, CSS and data analysis. I learned how to use Python to read a CSV file, count data and create graphs. I also learned how to build a website using headings, paragraphs, images and links. CSS helped me improve the appearance of the website by changing colours, fonts, spacing and borders.
I also improved my ability to explain information clearly. Instead of only making graphs, I had to describe what each graph showed and explain why the results were important. This helped me understand how data analysis can be used to find patterns and present information clearly.